Step 3 Market Audit 1
Ascertain If The Market Conditions Are Favourable Or Not
Now you’ll have a number of audiences, and there may be more than one that looks viable. But viable in terms of problem affliction need not mean viable in terms of market.
So in this section you will note various market conditions. Some of the information to be obtained is in response to things from CB Insights Top 12 Reasons Startups Fail, CB Insights 406 Startup Failure Post Mortem, Startup Genome Report, Failory, Startup Graveyard, and a plethora of other places.
Some of it is the beginning of a competition audit, something that will need to be done extensively later on. The reason it is not done thoroughly now is because there is no point digging into this spot too much at this moment in time.
The competition can influence you too much, and it may somewhat incarcerate you. Be aware of them, but no need to stalk them.
User Interface
Numbered Sections
The image shows the overall look of the UI at this step. The following sections are present in the UI:
1. Market Record2. Notes: Sources Used
3. Size, Growth, Key Points, Opportunity
4. Trends, Barriers To Entry
5. Competition
6. Additional Audiences, Product Categories
7. Results
8. Your Decision

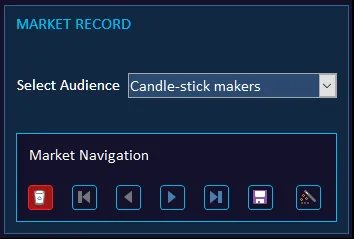
Section 1: Market Record
In the dropdown box labeled ‘Select Audience’, you will select an audience that you assessed in Step 2. Once all information has been submitted you click on the new record icon (far right), and select another market to audit.

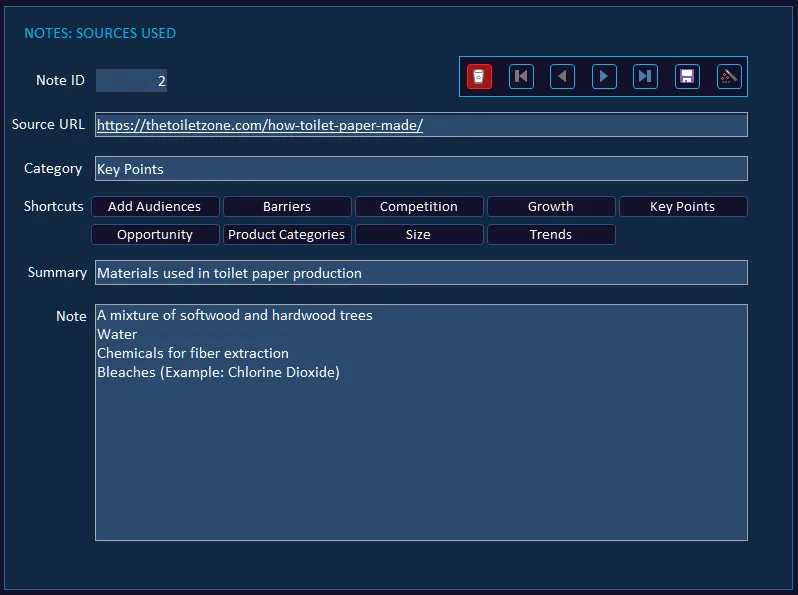
Section 2: Notes - Sources Used
Make a note of the sources you use. Structure them within categories, add a summary, and the actual part of the information that you used.
There are shortcut buttons (Add Audiences, Barriers, etc) you can use to denote the category. You can still type in the ‘Category’ text box if you want to add a different category.

Section 3: Size, Growth, Key Points, Opportunity
Size: self-explanatory, however the minimum size needed will depend on if you plan to go down the outside-investment route or not.
Growth rate: obviously you don’t want a market that is shrinking.
Key points: again self-explanatory.
Opportunity: the why now bit. What is the status and movement in the market that indicates now is a good time for your startup.

Alongside the text inputs are some numbers. You will submit scores out of 10, to indicate the magnitude of the respective point.
Accessibility Score is for you to indicate, how difficult it would be to enter the market, and the degree of liquidity in the distribution channels. I recommend you fill this in after you have submitted information under the other tabs. There is no text equivalent for accessibility just in case you think I forgot to put it in.
Section 4: Trends, Barriers To Entry
Trends: state what things are coming in, what things are at a high level, and what things are waning. Trends can be a double-edged sword, and some of them can be nothing but hype, but keep tabs on it, somethings could be harnessed for a brief moment, others could be far more profound.
Barriers To Entry: a big one, looking back at some of the startups that failed due to this, it can seem almost bizarre that they never looked into the barriers. If there are legal and regulatory barriers, then you really need to come correct, otherwise you won’t get on the field. Some barriers may be applicable only to you in terms of cost of entry.

Section 5: Competition
As you are assessing the market, you will come across many potential competitors. I say potential because you haven’t launched yet.
Name and URL: no point explaining.
Business Type: B2SMB, B2Enterprise, B2C, C2C, D2C. There is no umbrella B2B due to the vastly different ball game between small businesses and enterprises.
Tech Level: state what their tech level is at, this will be somewhat arbitrary, but once you have defined the groups, stay consistent in terms of categorisation.
Traffic Volume: to get an idea of the general volume in the market. The other reason for this is, if you think Google (Ads, Search) is to be your distribution channel, but the volume isn’t there in terms of keywords, then Traffic Volume would indicate that other channels are being used.

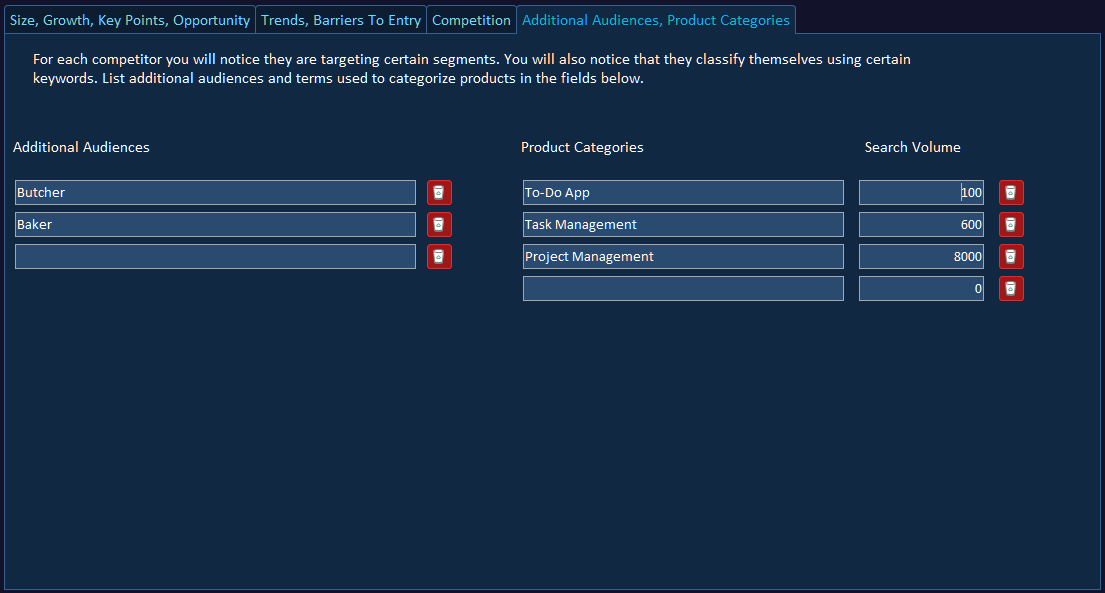
Section 6: Additional Audiences, Product Categories
Additional Audiences: competitors may well be providing services in other domains and industries. There may be a gap in the market, an under-served audience, an ill-serviced audience, defining a different early adopter beach-head, etc. This will also aid you if you need to pivot. Of course pivots can be about any element of the business model but nonetheless it doesn’t take long at all to jot them down.
Product Categories: competitors will be classifying their solution in many different ways for any number of reasons, positioning, ease of entry, under-served, etc. They may even be doing it to utilise a particular channel (SEO, Google Ads).

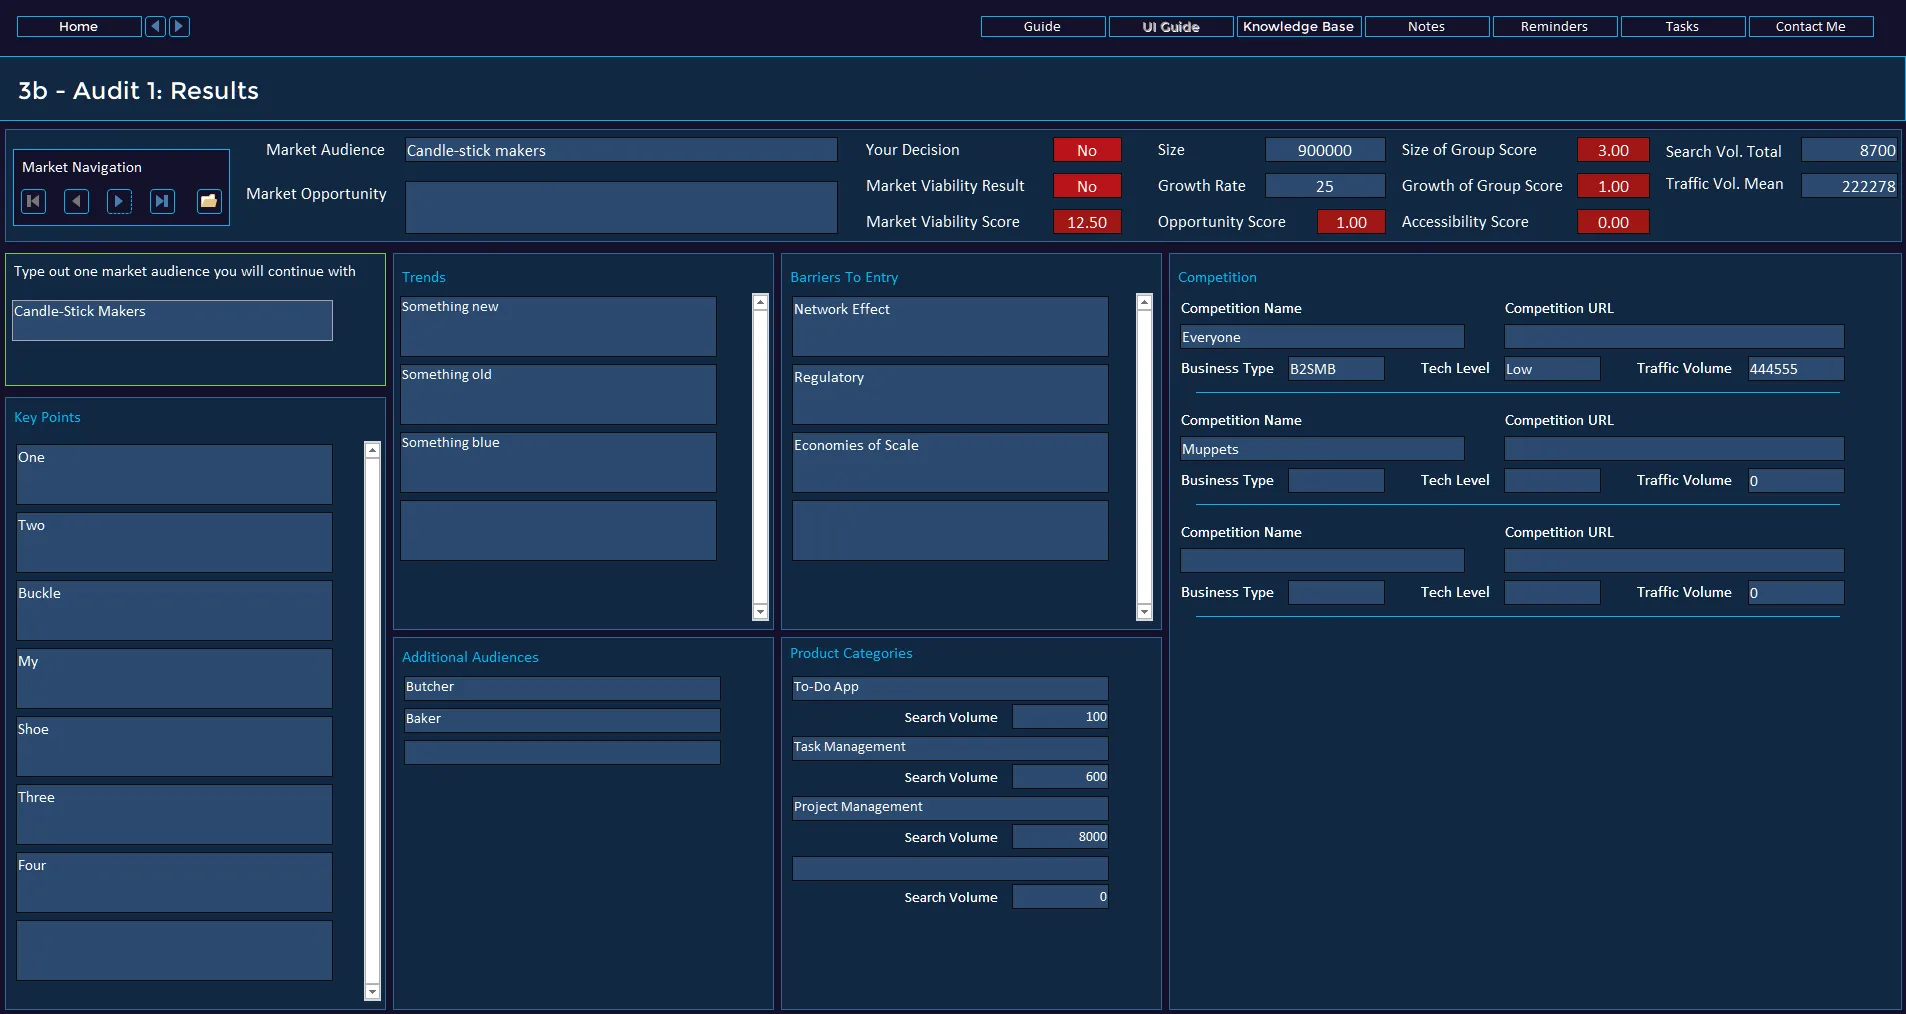
Section 7: Results

Once all fields are filled in, you’ll click on the ‘Update Charts’ button (not visible here). There are 5 charts, made up in the following way:
Search Volume Total: the total number of searches, presented as a number.
Traffic Volume Mean: the mean average of Traffic Volume, presented as a number.
Growth Rate: the percentage you submitted, presented as a percentage.
Market Size: the market size number you submitted, presented as a number.
Market Viability Score: summing and then averaging the scores for Size of Group, Growth of Group, Opportunity, Accessibility; presented as a percentage.
Section 8: Your Decision
In this section you will see an indicator under Market Viable that in this instance says No (red font). This result is based on the Market Viability Score as a percentage.
If the percentage is above or equal to a number of your choosing, then the result will be yes, otherwise it will be no. You define the number, which is called the Pass Mark in Project Settings.
The final decision to continue or not with the group, is of course yours to make, and you can do so using the dropdown under Your Decision.

Step 3b: Market Audit 1 Results

Step 3b is where you can see the information submitted in a more easily digestible manner. You can’t edit the information in this step, it is read-only.
